If you care about real estate as an investor/advisor or just someone simply trying to make sense of the market, understanding long-term property price growth matters. It tells you where value has been and offers clues about where it might go. It shapes portfolio strategy and influences when to buy or sell.
That’s what it takes to take advantage of property investment opportunities!
Fret not; This post looks at the big gears that really move prices over time. We’ll walk through the following:
● Macro forces
● The human side of demand
● The role of jobs and wages
● The impact of policy
● How technology and infrastructure can quietly, steadily change what homes are worth
Ready? Let’s dive right in!
Understanding Property Price Growth
Property price growth is the steady change in the value of homes and other real estate over time, usually measured as annual appreciation. It’s often tracked in both:
- Nominal terms (including inflation) – which matter for equity-building and loan-to-value dynamics.
- Real terms (adjusted for inflation) – that tell you if you’re gaining purchasing power.
Historically, prices move in cycles but tend to climb over long periods.
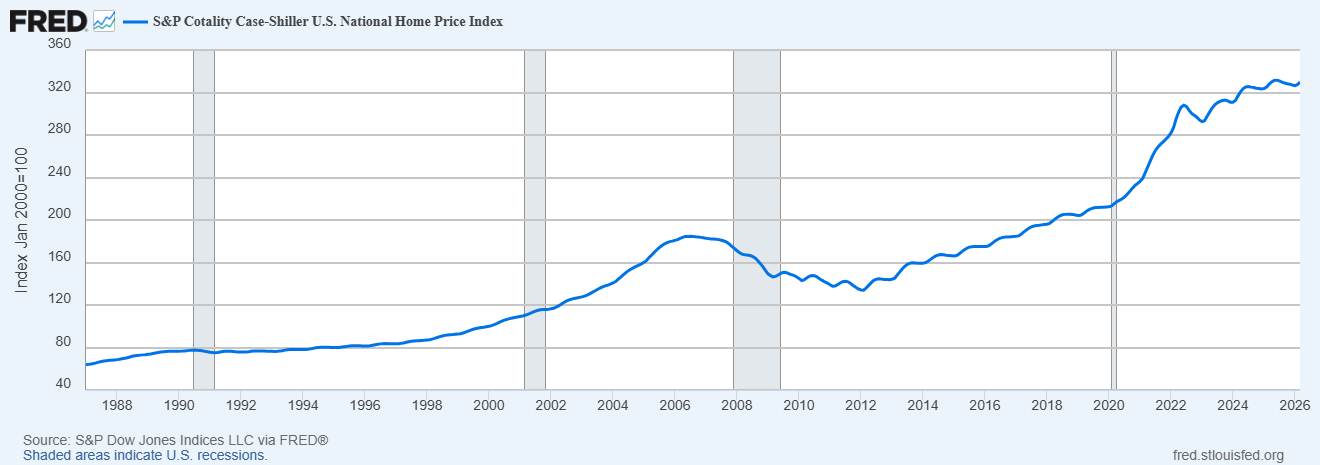
In the U.S., the S&P CoreLogic Case‑Shiller national index has more than tripled since 2000, despite the housing bust and other shocks along the way.
See that arc in the data from the Federal Reserve’s FRED database below. It shows long-run appreciation with periods of cooling and recovery layered on top of that upward trend.
Five Economic Drivers of Property Price Growth
1. Macro-economic influences
Big-picture economics set the backdrop for every local market. Three variables matter most:
- Interest rates: When central banks raise or lower mortgage rates, their costs follow. That changes monthly payments. That expands or shrinks the pool of qualified buyers. And that can tilt prices for years, not months. We saw this play out as 30‑year mortgage rates fell near 3% in 2020–2021, then climbed above 7% in 2023–2024.
- Rising inflation: Real estate is a tangible asset. And over long stretches, it can serve as a partial inflation hedge. Construction costs and rent growth tend to pass through to prices. Academic work on long-run returns finds housing has delivered solid real returns across many countries. High inflation can also push interest rates higher, temporarily sapping demand.
- GDP growth: Healthy economies create jobs and businesses. Not to mention household formation…all fuel for housing demand. Cross-country work from the International Monetary Fund (IMF) shows a clear relationship between macro growth and home values over time.
2. Demographics and population growth
Demography doesn’t just tell you who lives in a place. It tells you where demand is heading. This begs the question: which demographics drive homeownership?
- Population growth: More people usually means more households. When supply can’t keep up, prices rise. You see this in fast-growing metros where building lags population inflows.
- Urbanization trends: Cities pull in talent and capital, especially when transit and amenities lower the daily friction of life. The United Nations projects that about 68% of the world will live in urban areas by 2050- up from roughly 56% today!
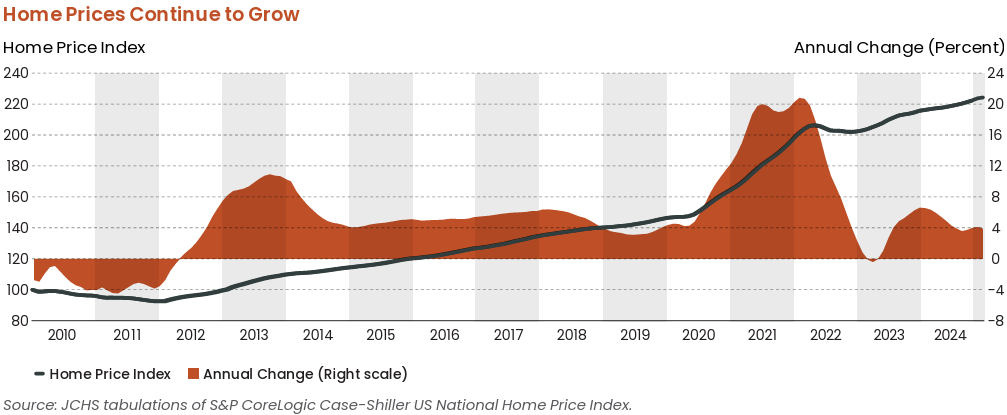
- Age demographics: Millennials and Gen Z, as they age into peak household-formation years, drive steady demand. Meanwhile, aging populations shift demand toward accessible homes and healthcare‑rich neighborhoods. The Harvard Joint Center for Housing Studies tracks these transitions and how they ripple through affordability and construction needs.
3. Employment and income trends
Paychecks and job security matter. A lot.
- Job market stability: Job security transforms renters into buyers. When people feel confident about their employment prospects, they’re willing to commit to homeownership. Strong local job markets with diverse industries create the foundation for steady property appreciation over time. The availability of well-paid jobs is one of the key factors supporting housing demand. As local economies expand, many professionals turn to job platforms such as Jooble to find new career opportunities, contributing to population growth and increased demand for housing in economically active regions.
- Wage growth: Rising wages expand purchasing power and help households qualify for larger loans. This puts upward pressure on prices, especially where new construction is constrained. Conversely, stagnant incomes limit how far prices can run, even when rates are low.
For example, someone managing an ongoing health and wellness routine may factor those recurring healthcare expenses into their household budget. A stable income not only helps cover those costs consistently but also gives prospective buyers greater confidence, particularly when taking on a long-term financial commitment, such as a mortgage.
4. Government policies and regulations
Rules of the game shape supply and demand over years, not quarters.
- Taxes and incentives: First‑time buyer credits and mortgage interest policies all change the timing and affordability equation. For instance, the 2009 U.S. First‑Time Homebuyer Tax Credit pulled forward demand and briefly boosted transaction volumes according to multiple evaluations.
- Development regulations: Policy design can affect housing supply and price stability. Zoning reforms that allow more density create conditions for sustainable market growth. The most successful markets balance accessibility for buyers with attractive returns for investors.
A broad NBER review links tight land-use regulation to higher price levels over time.
5. Technology and innovation
Tech changes what people value at home and where they want to live. Think of smart upgrades for homebuyers and even AI-powered property valuation for realtors.
- Real estate technology: Technology integration directly correlates with property desirability. Smart home features and high-speed connectivity (even proximity to tech employment centers) command premium prices. Properties that embrace innovation tend to appreciate faster in today’s market.
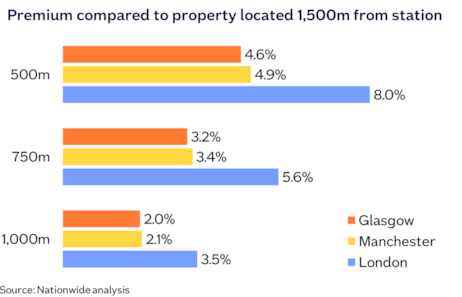
- Infrastructure developments: New transit lines, highway interchanges, and airport expansions shrink commute times and pull neighborhoods onto buyers’ short lists. The “Crossrail premium” in London, estimated by market and lending studies, showed notable price uplifts near stations as service neared completion.
Case Studies and Real-World Examples
Silicon Valley: Technology and employment growth
Silicon Valley’s tech flywheel is a classic example of how jobs and innovation power appreciation.
Over the last two decades, the San Jose–Sunnyvale–Santa Clara metro saw substantial price gains alongside booming tech employment and high incomes. As reflected in the FHFA house price index data:
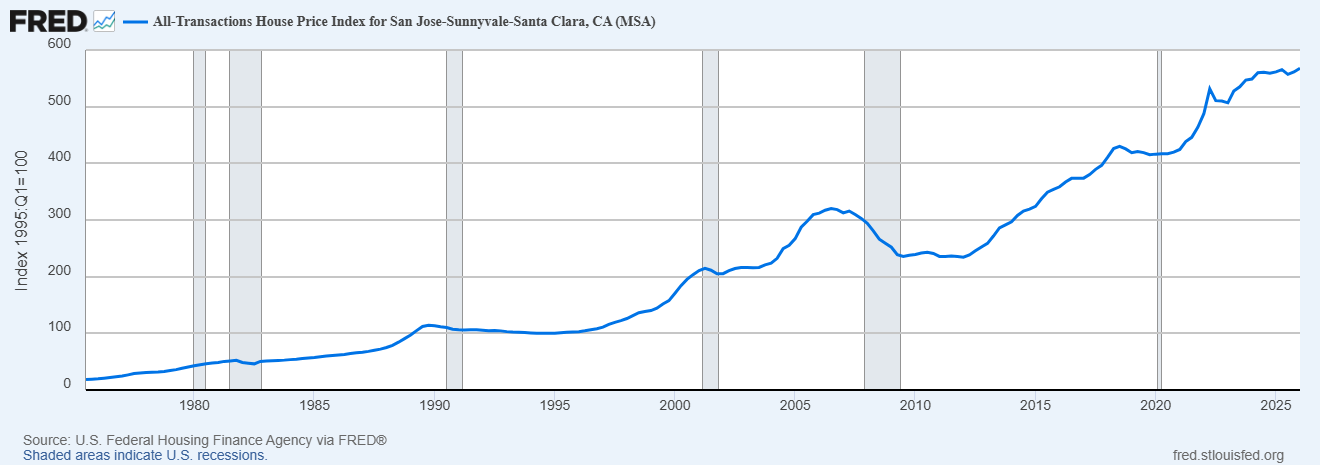
When you pair sustained demand with limited new supply, prices climb and tend to stay elevated.
Auckland: Zoning reform and housing supply
Policy reform can also leave a long mark. A sweeping upzoning launched in 2016, and Auckland’s Unitary Plan allowed more density in large parts of the city.
Follow‑up research links the reform to meaningful increases in housing supply and evidence of moderated price pressures relative to trend. An example of how loosening constraints can help rebalance markets over time.
London and Seattle: Infrastructure investment and property values
Infrastructure compounds value over time even if the process is less dramatic than tech booms or policy shifts.
Crossrail in London and light rail expansions in cities like Seattle helped bring far‑flung neighborhoods within a practical commute. As services come online and reliability improves, buyer maps change, and so do comps.
You can see the same pattern around new stations in many metros, even if the exact premium varies by project and neighborhood context.
Future Outlook
Long-term price growth flows from a few core channels:
- The cost of money
- The speed of the economy
- Who’s moving where
- How secure and well‑paid jobs are
- What governments allow and encourage
- The technologies and infrastructure that make neighborhoods easier and more enjoyable to live in
None of these forces work in isolation, and they rarely move in straight lines.
A few cross‑currents are worth watching:
- Hybrid work is still reshaping demand between city cores and suburban hubs
- Aging populations and immigration will affect household formation differently across regions
- Decarbonization and climate risk are becoming price variables too, as insurance costs and local hazards find their way into valuations
- And yes, interest rates will keep acting like a thermostat for the whole system
If you’re investing/advising, keep one eye on the local story and the other on these broader drivers for property price growth. Connect the dots between them…and you’ll ultimately spot durable value before it shows up in the comps!
About the Author: David Abraham is an accomplished tech lawyer and legal marketing expert with a robust background in artificial intelligence, fintech, human rights law, and digital marketing. An active sports enthusiast, avid reader, and chess player, David combines his legal expertise with marketing acumen to drive innovation at the intersection of law, tech, and business.