Steve Jamrok
Realtor, GRI, ABR, E-Pro
Realty Executives Premier
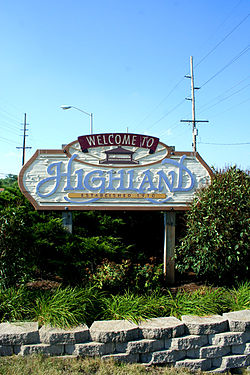
This week's market snap shot looks at Highland, IN. Let's take a look at how the first 2 months of 2019 compare with 2018.
??January 1, 2019- February 20, 2019
??20 Homes Sold
?? Average Sales Price- $172,700
?? Average Price / Square Foot-$105
?? Pending Home Sales- 15 (under contract to close)
??January 1, 2018- February 20. 2018
?? 26 Homes Sold
?? Average Sales Price- $167,146
?? Average Price/ Square Foot- $91
As you can see while we had less homes sold to start 2019, the average sales price is up and the price per square foot is up significantly. The decrease in homes sold is reflection of lower inventory to start this year.
Click the link to check out current homes for sale in Highland.?? Curious of your neighborhood market value or your homes current value? Give me a call and I'll be happy to discuss your market value. 219-306-0333.
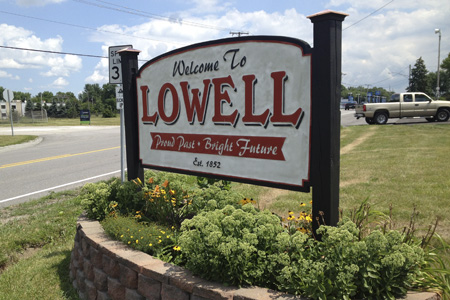
Good Morning! It's a great day to take a look a some market stats. Today, I'm going to check out Lowell, IN. Let's see how their first month of the year compared to last year.
??January 2019
?? 20 Homes Sold
?? Average Sales Price- $220,199
?? Avg. Price per square foot- $107
??Pending Home Sales (currently under contract)- 50
??January 2018
?? 26 Homes Sold
?? Average Sales Price- $233,504
?? Avg. Price per square foot- $106
While the average sales price is down month over month, there were less homes sold and the average price per square foot was up slightly. What really intrigues me is the amount of homes currently under contract waiting to close. This is in large part due to the amount of new construction happening in your community. It will be interesting to see the effect of the average sales price as these homes start to close in the coming months.
Click the link below ?? to search the Lowell Market and if you are thinking of buying or selling, give me a call, 219-306-0333. I'd love to talk to you.
Most Popular Interior Design Trends for 2019
As the calander inches closer to sping, many of you are likely in the planning stages of your spring home improvement projects. Whether you're getting your home ready to sell or finally getting around to the updates you've put off, spring brings out the designer in all of us. But how do we decide which trends to follow?
The start of every year always brings us dozens of new trends for your home. It's time consuming and often, mind numbing sifting through all the publications and social media posts. So, I took the time to do it for you. I searched the internet to research and find you the 5 most common and popular trends for 2019. Continue reading to inspire the inner deisgner in you and and complete your dream projects.
1. BLACK IS BACK
From appliances, fixtures and accent strips to all black kitchen cabinets and islands. Black matte finishes are "in" for 2019. Couple black cabinets with natural wood textures, i.e...floors, shelving, accent walls.
2. TILE UP & OPEN UP
Tile backsplashes are still as popular as ever. But with more people trending to open shelving and open cabinets in their kitchens, tile backsplashes are becoming tile walls. Take the tile from the counter top to the ceiling. This will allow you to highlight the wall as it shows through the open cabinets and shelving.

3. WARMER & SOFTER COLORS
While grays ruled in 2018, people are trending to warmer and softer colors like Sherwin WIlliams "Color fo the Year" for 2019- Cavern Clay. Bold colored accent walls are still a great way to show off your personality, but stick to the warmer, softer tones throughout the home.
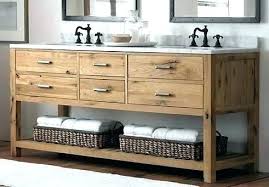
4. WOOD IN THE BATH
Natural and Nature are your key words for 2019 and that includes your bathroom where natural wood vanities rule. From reclaimed wood, bamboo, teak and rustic log finishes to name a few, natural wood vanities will rule for 2019.
5. LET NATURE IN
As I said, natural and nature are your key words when it comes to remodeling in 2019. Include elements of nature in your rooms, wood, greenery, functional accessories, concrete and stone. Also, merge rooms with the outside to help bring in the natural elements. Large doors that open from the kitchen or living area that make the transition from indoors to outdoors seemless will make your home stand out in 2019.
While there are many, many more styles trending for your home in 2019, these were some of the most common and popular and all came up in multiple publications and searches. Nature and natural are definitely key words this year. So if you do anything, try to incorprate more of a natural feel to your home and incorporate elements of nature throughout.
Please reach out with questions. I'd be happy to discuss these and other ideas for your home. Happy Designing!
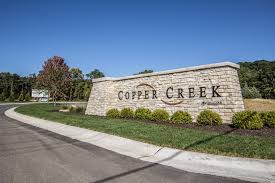
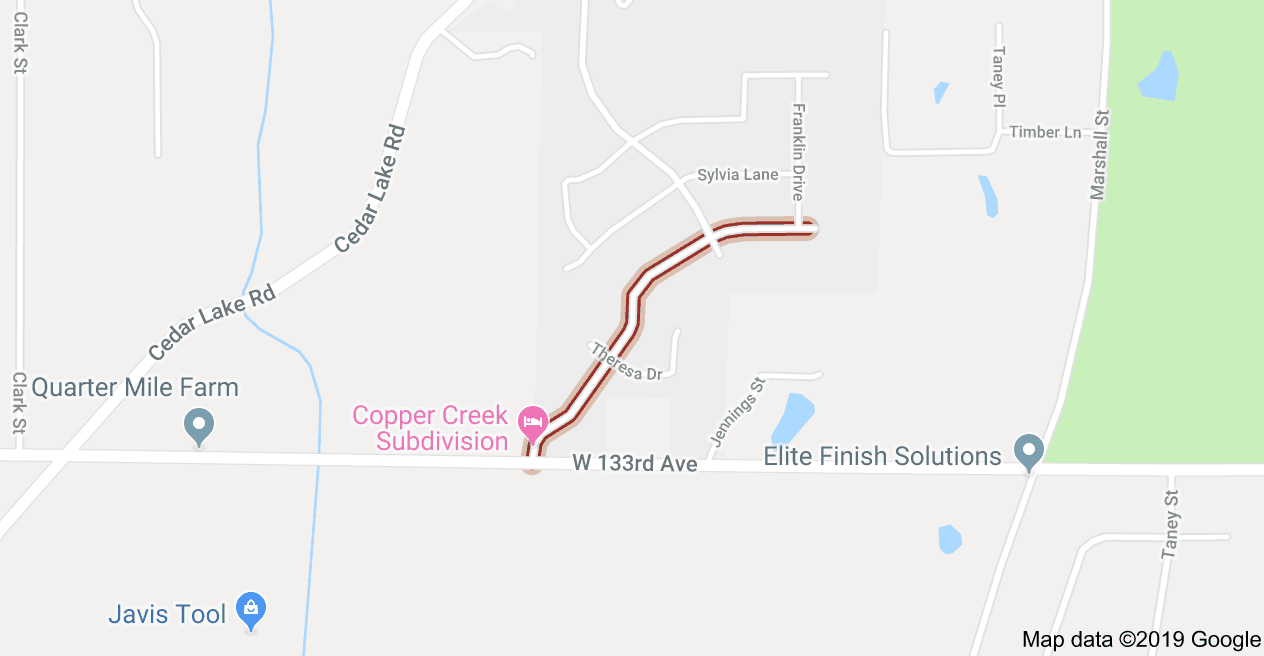
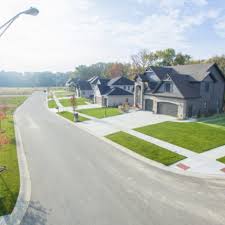
Neighborhood Spotlight- Copper Creek, Crown Point
Situated about 3 miles from Historic Downtown Crown Point, Copper Creek is one of Crown Point's newest subdivions. Located on the south side of the City, Copper Creek is minutes away from the Southlake YMCA, Crown Point High School and Lemon Lake County Park.
Copper Creek Belongs to the award winning Crown Point School system. Students attend Lake Street Elementary School, Taft Middle School and Crown Point High School.
Homes in Copper Creek range in price from the low $400's up to $600,000. Copper Creek does have a HOA and home designs/ addittions must be approved by the board. The develpers have done a fantastic job of keeping the mature trees and building around the natural landscape of the area.
If you have any questions about Copper Creek or any other subdivision in Crown Point or Northwest Indiana, please give me a call, 219-306-0333 or check out my web site Stevejamrok.com.
You can also watch my neighborhood drive through below-

"How's the Real Estate Market?" This is one of the most frequent questions I get asked as a Realtor. So, today, I would like to share with you the Year End Stats for single family home sales in our Northwest Indiana Communities. I included 2017 vs 2018 to give us a comaprison. Overall, it was a great year as average home prices were up in every community. The average days on market also decreased acrossed the board. We are still dealing with a lack of inventory as eveidenced by the drop in the number of homes sold.
Crown Point-
2018- Avg. Sales Price- $256,062/ 602 Units Sold/ 65 Days on Market
2017- Avg. Sales Pirce- $244,538/ 604 Units Sold/ 66 Days on Market
Winfield-
2018- Avg. Sales Price- $269,950/ 124 Units Sold/ 62 Days on Market
2017- Avg. Sales Price- $265,000/ 143 Units Sold/ 66 Days on Market
St. John-
2018- Avg. Sales Price- $354,859/ 277 Units Sold/ 81 Days on Market
2017- Avg. Sales Price- $354,438/ 279 Ubits Sold/ 93 Days on Market
Cedar Lake-
2018- Avg. Sales Price- $198,150/ 237 Units Sold/ 69 Days on Market
2017- Avg. Sales Price- $190,623/ 247 Units Sold/ 75 Days on Market
Lakes of the Four Seasons-
2018- Avg. Sales Price- $234,835/ 157 Units Sold/ 66 Days on Market
2017- Avg. Sales Price- $225,602/ 133 Units Sold/ 77 Days on Market
Schererville-
2018- Avg. Sales Price- $274,784/ 359 Units Sold/ 61 Days on Market
2017- Avg. Sales Price- $261,216/ 382 Units Sold/ 77 Days on Market
Lowell-
2018- Avg. Sales Price-$224,606/ 357 Units Sold/ 79 Days on Market
2017- Avg. Sales Price-$206,294/ 362 Units Sold/ 81 Days on Market
Merrillville-
2018- Avg. Sales Price-$149,455/ 503 Units Sold/ 60 Days on Market
2107- Avg. Sales Price-$136,023/ 449 UNits Sold/ 64 Days on Market
Valparaiso-
2018- Avg. Sales Price-$248,392/ 666 Units Sold/ 67 Days on Market
2017- Avg Sales Price-$235, 487/ 686 Units Sold/ 79 Days On Market
Chesterton-
2018- Avg. Sales Price-$263,657/ 491 Units Sold/ 79 Days on Market
2017- Avg. Sales Price-$250,205/ 474 Units Sold/ 82 Days on Market
Hobart-
2018 Avg. Sales Price-$149,428/ 469 Units Sold/ 56 Days on Market
2017 Avg. Sales Price-$136,779/ 499 Units Sold/ 62 Days on Market
Dyer-
2018- Avg. Sales Price-$282,319/ 230 Units Sold/ 45 Days on Maket
2017- Avg. Sales Price-$255,055/ 232 Units Sold/ 51 Days on Market
As I always say, real estate is local and I will be updating Community stats throughout the year and I will also highlight specific neighborhoods. So check back often or message me to include your neighborhood.
Don't see your Community on the list or want your neighborhood featured, just shoot me a message and I'll get you the stats!