Every time there’s a news segment about the housing market, we hear about the affordability challenges buyers are facing today. Those headlines are focused on how much mortgage rates have climbed this year. And while it’s true rates have risen dramatically, it’s important to remember they aren’t the only factor in the affordability equation.
Here are three measures used to establish home affordability: home prices, mortgage rates, and wages. Let’s look closely at each one.
1. Mortgage Rates
This is the factor most people are focused on when they talk about homebuying conditions today. So far, current rates are almost four full percentage points higher than they were at the beginning of the year. As Len Kiefer, Deputy Chief Economist at Freddie Mac, explains:
“U.S. 30-year fixed mortgage rates have increased 3.83 percentage points since the end of last year. That's the biggest year-to-date increase in rates in over 50 years.”
That increase in mortgage rates is impacting how much it costs to finance a home purchase, creating a challenge for many buyers that’s pricing some out of the market. While the current global uncertainty makes it difficult to project where mortgage rates will go in the future, experts do say that rates will likely remain high as long as inflation does.
2. Home Prices
The second factor at play is home prices. Home prices have made headlines over the past few years because they skyrocketed during the pandemic. Now, the most recent Home Price Index from S&P Case-Shiller shows home values continued to decelerate for a fifth consecutive month (shown in green in the graph below):
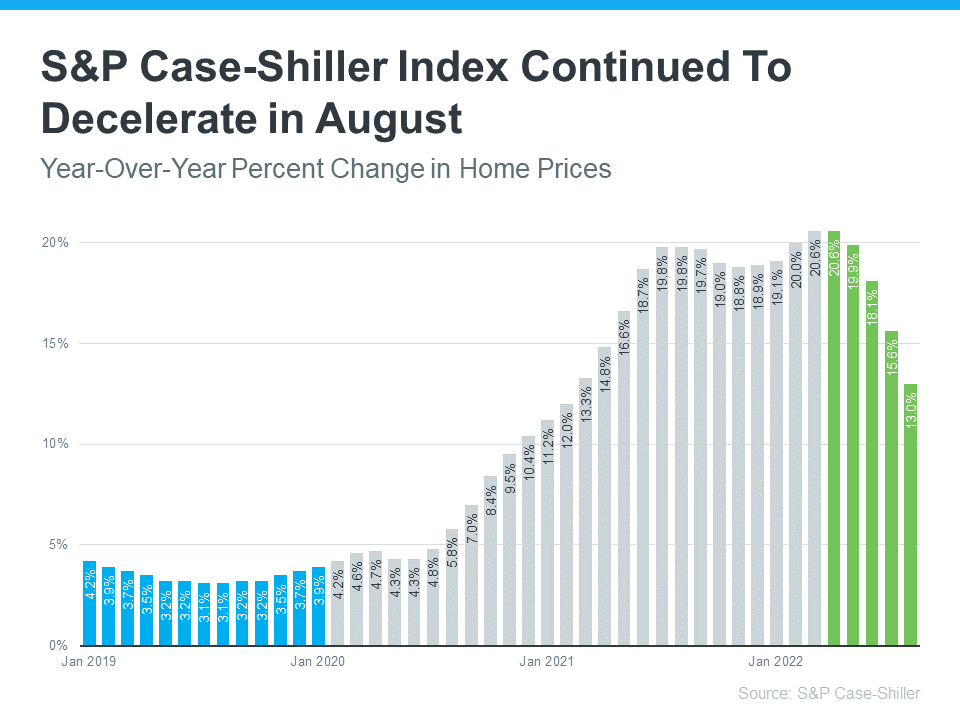
This deceleration is happening because higher mortgage rates are moderating demand, and as a result, easing the buyer competition and bidding wars that previously drove prices up.
What’s worth noting though, is how much higher home prices still are than they were before the pandemic (shown in blue in the graph above). Even now, we have a long way to go to get to more normal levels of home price appreciation, which is historically closer to 4%. When both mortgage rates and home prices are high, affordability and your purchasing power become a greater challenge.
But while prices are still elevated in many markets, some areas are seeing slight declines. It all depends on your local market. For insight into what’s happening in your area, reach out to a trusted real estate professional.
3. Wages
The one big, positive component in the affordability equation is the increase in American wages. The graph below uses data from the Bureau of Labor Statistics (BLS) to show how wages have grown over time. This year is no exception.
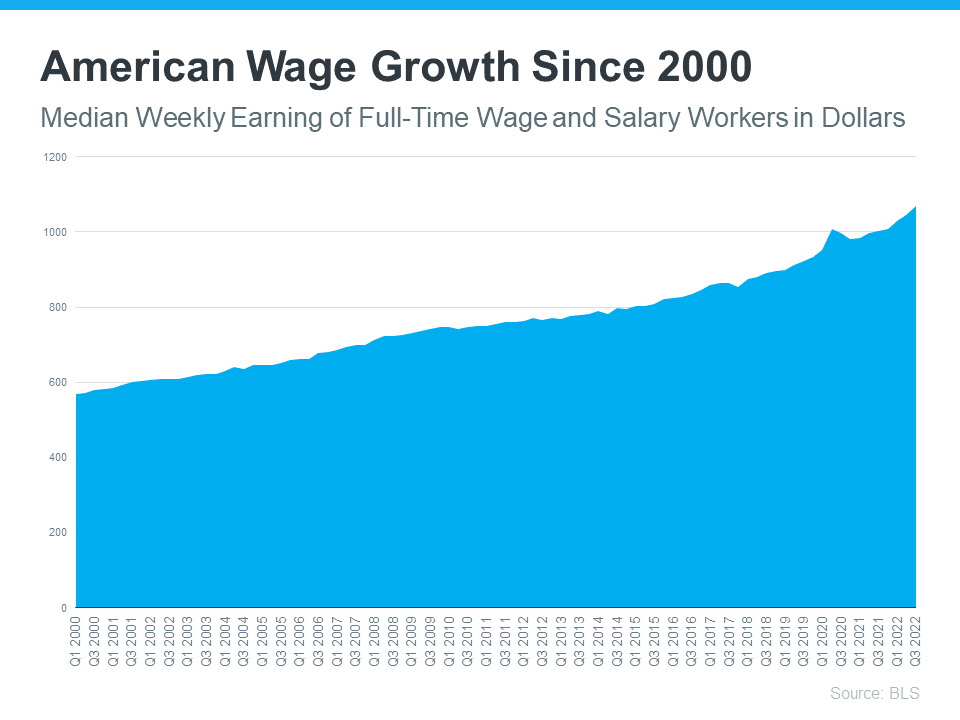
As the Bureau of Labor Statistics (BLS) reports:
“Median weekly earnings of the nation's 120.2 million full-time wage and salary workers were $1,070 in the third quarter of 2022 (not seasonally adjusted), the U.S. Bureau of Labor Statistics reported…This was 6.9 percent higher than a year earlier…”
So, when you think about affordability, remember the full picture includes more than just mortgage rates. Home prices and wages need to be factored in as well. Because wages have been rising, they’re a big reason why serious buyers are still purchasing homes this year.
If you have questions or want to learn more, reach out to a trusted advisor who can explain how all of these variables work together and what’s happening in your area. As Leslie Rouda Smith, President of the National Association of Realtors (NAR), says:
“Buying or selling a home involves a series of requirements and variables, and it's important to have someone in your corner from start to finish to make the process as smooth as possible… and objectivity to deliver trusted expertise to consumers in every U.S. ZIP code.”
Bottom Line
To learn more, let’s connect today and make sure you have a trusted lender so you’re able to make an informed decision if you’re planning to buy or sell a home right now.


![Homeownership Wins Over Time [INFOGRAPHIC] | MyKCM](https://files.mykcm.com/2022/11/03124833/20221104_homeownership-wins-over-time-MEM-1046x2364.png)