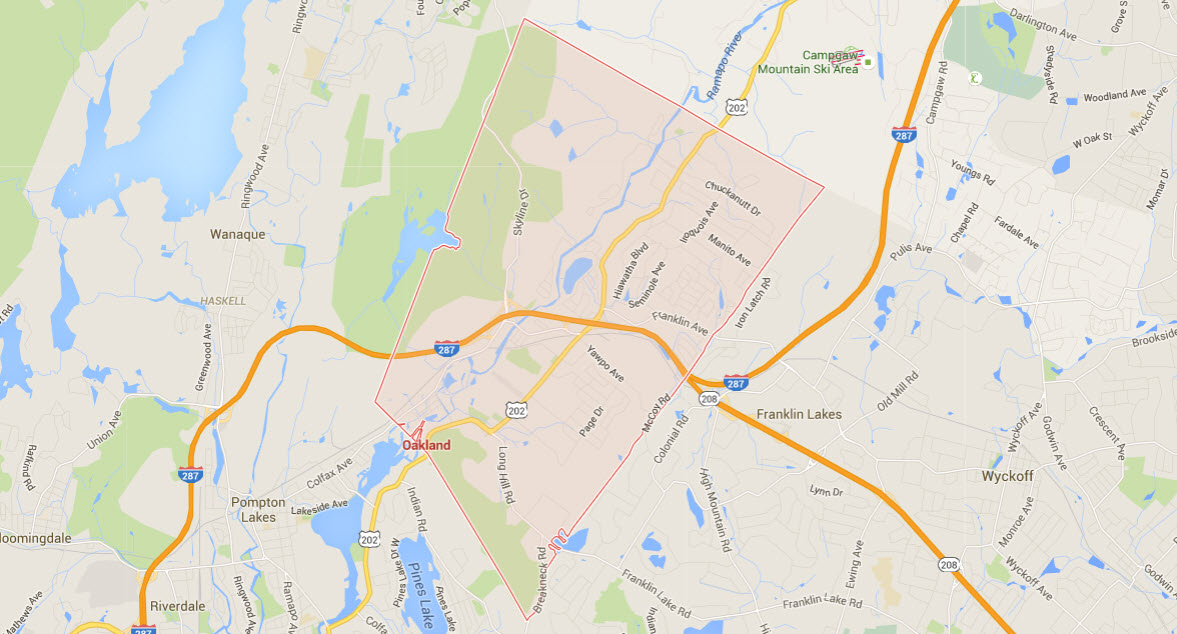
Home sales in Oakland NJ have been varying monthly. Oakland, NJ is a very desirable area to live in according to many home shoppers. The town of Oakland is surrounding by the Ramapo mountains and has many recreational activities.
Homes sales can vary month to month in Oakland, NJ. In slow months, you will see as low as 4, 5 or 6 home sales in the month. In busy months you can see as much as 10,15,20, or more sales!
Home sale prices on average seem to be between the upper 300's to upper 400's. In fact, the median house or condo value in Oakland NJ in 2013 was $441,365 in comparison to $245,400 back in 2000. (per citydata) More data from City data states: Mean prices in 2013: All housing units: $517,875; Detached houses: $558,035; Townhouses or other attached units: $493,772; In 2-unit structures: $433,033; In 3-to-4-unit structures: $378,297; In 5-or-more-unit structures: $306,077; Mobile homes: $212,030
Below is a chart with some home sales statistics in Oakland NJ, provided by Melissa data.
Month Sale Published Number of Sales for Month
06-2016 12 $388,000
05-2016 10 $425,000
04-2016 8 $422,000
03-2016 23 $443,000
02-2016 6 $445,000
01-2016 11 $383,000
12-2015 13 $407,000
11-2015 13 $532,000
10-2015 7 $401,000
09-2015 15 $421,000
08-2015 17 $461,000
07-2015 15 $462,000
06-2015 17 $460,000
05-2015 25 $424,000
04-2015 5 $395,000
03-2015 9 $501,000
02-2015 10 $380,000
01-2015 18 $387,000
12-2014 11 $506,000
11-2014 14 $446,000
10-2014 8 $452,000
09-2014 30 $470,000
08-2014 19 $463,000
07-2014 11 $479,000
06-2014 12 $445,000
05-2014 8 $459,000
04-2014 7 $512,000
03-2014 7 $430,000
02-2014 6 $445,000
01-2014 7 $505,000
12-2013 9 $419,000
11-2013 14 $442,000
10-2013 12 $386,000
09-2013 13 $353,000
08-2013 15 $429,000
07-2013 26 $422,000
06-2013 20 $443,000
05-2013 16 $430,000
04-2013 21 $396,000
03-2013 11 $385,000
02-2013 9 $408,000
01-2013 6 $360,000
12-2012 9 $508,000
11-2012 1 $448,000
10-2012 8 $321,000
09-2012 7 $461,000
08-2012 9 $452,000
07-2012 12 $441,000
06-2012 12 $410,000
05-2012 9 $438,000
04-2012 7 $378,000
03-2012 1 $335,000
02-2012 4 $347,000
01-2012 9 $365,000
12-2011 6 $660,000
11-2011 8 $414,000
10-2011 8 $414,000
09-2011 9 $479,000
08-2011 10 $437,000
07-2011 12 $474,000
06-2011 5 $329,000
05-2011 7 $507,000
04-2011 5 $415,000
03-2011 13 $418,000
02-2011 3 $539,000
01-2011 7 $539,000
12-2010 9 $524,000
11-2010 9 $472,000
10-2010 8 $462,000
09-2010 6 $469,000
08-2010 5 $444,000
07-2010 15 $505,000
06-2010 5 $277,000
05-2010 6 $416,000
04-2010 8 $478,000
O
Save